|
|
|
Data Analysis

Our system offers you a variety of different data analyzation tools.
Both individual patient responses and overall outcomes trends can be
monitored using the collection of graphs, charts, and other utilities
available on our site. Click on the pictures below to learn more about the
data analyzation tools that we offer:
Select Patient:
|
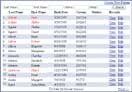
View Data:
|
Patient Graphs:
|
Quality Dashboards:
|
Practice Dashboards:
|
Patient Dashboards:
|
Aggregate Data:
|
Queries:
|
DataBeacon:
|
|
|
|
|
|
|
|
|
Graphing Patient Data
Graphing the outcomes data for a particular patient is the best way to gain an
understanding of how that person is responding to your care. With this in mind,
we designed the interface seen below. On the left side of the screen under the
"Graphs" section are each of the graphable forms that "Paul Abbott" has completed.
When one of these forms is selected, the graph of those scores is displayed.
In the below screen shot, Paul's SF-36 scores are being displayed in the graph.
|
|
|
|
|