|
|
|
Data Analysis

Our system offers you a variety of different data analyzation tools.
Both individual patient responses and overall outcomes trends can be
monitored using the collection of graphs, charts, and other utilities
available on our site. Click on the pictures below to learn more about the
data analyzation tools that we offer:
Select Patient:
|
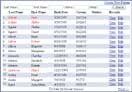
View Data:
|
Patient Graphs:
|
Quality Dashboards:
|
Practice Dashboards:
|
Patient Dashboards:
|
Aggregate Data:
|
Queries:
|
DataBeacon:
|
|
|
|
|
|
|
|
|
Patient Dashboards
Understanding one's patient population is something that very few surgeons can
claim to do with accuracy. With OrthoSight's "Patient Dashboards", however, doing so
is a breeze. In a few quick clicks, you can see exactly which patient demographics
are getting which treatments, and how certain treatments affect certain patient
demographics. The report below outlines the typical gender, weight, height, and age
distributions for a surgeon's total joint population.
|
|
|
|
|